2024.12.19 | Heart Health
The Problem With Cardiovascular Risk Calculators
Risk calculators like the Framingham Risk Score have long been a cornerstone of cardiovascular medicine, estimating your chances of a heart attack or stroke over the next 10 years. But here's the problem: cardiovascular disease (CVD) is a slow, silent process that often begins in your teens and unfolds over decades. Limiting the assessment to just 10 years is far too narrow to fully capture the long-term damage accumulating in your arteries over a lifetime.
The True Culprit: ApoB
To understand why these calculators fall short, you need to know about ApoB. This protein is at the core of CVD. Every cholesterol particle capable of causing plaque buildup in your arteries—like LDL, VLDL, and lipoprotein(a)—carries ApoB. Think of these particles as tiny, sticky invaders. They slip into your artery walls, get trapped, and trigger chronic inflammation.
At low levels, your body can handle this. Immune cells called macrophages act like cleanup crews, clearing out trapped ApoB particles and keeping your arteries healthy. But when ApoB levels get too high, the system becomes overwhelmed. These macrophages start dying and piling up in your artery walls, snowballing into bigger plaques over time.
Your body does its best to patch things up, but these plaques can eventually rupture, causing a blood clot that blocks flow to your heart or brain. That's how heart attacks and strokes happen. That's how over 700,000 Americans die every year.
Tracking ApoB Over a Lifetime
ApoB is the single most important biomarker for understanding your cardiovascular risk. The higher your ApoB levels, the more particles are attacking your arteries and driving plaque formation. It provides far more insight than just measuring LDL or total cholesterol levels.
Most experts agree that keeping ApoB below 80 mg/dL is ideal, but this highlights an important limitation of one-time risk calculators and single ApoB readings—they only provide a snapshot. A single reading might show your risk is low for now, but it says nothing about the damage already done or the risk that's quietly building for the future.
Calculating Lifetime Exposure
Let me explain this with my own numbers. The first time I measured my ApoB, my level was 92 mg/dL—not far from optimal. Most doctors would've looked at that and said, "You're fine, nothing to worry about." And based on the standard risk charts, they wouldn't have been wrong.
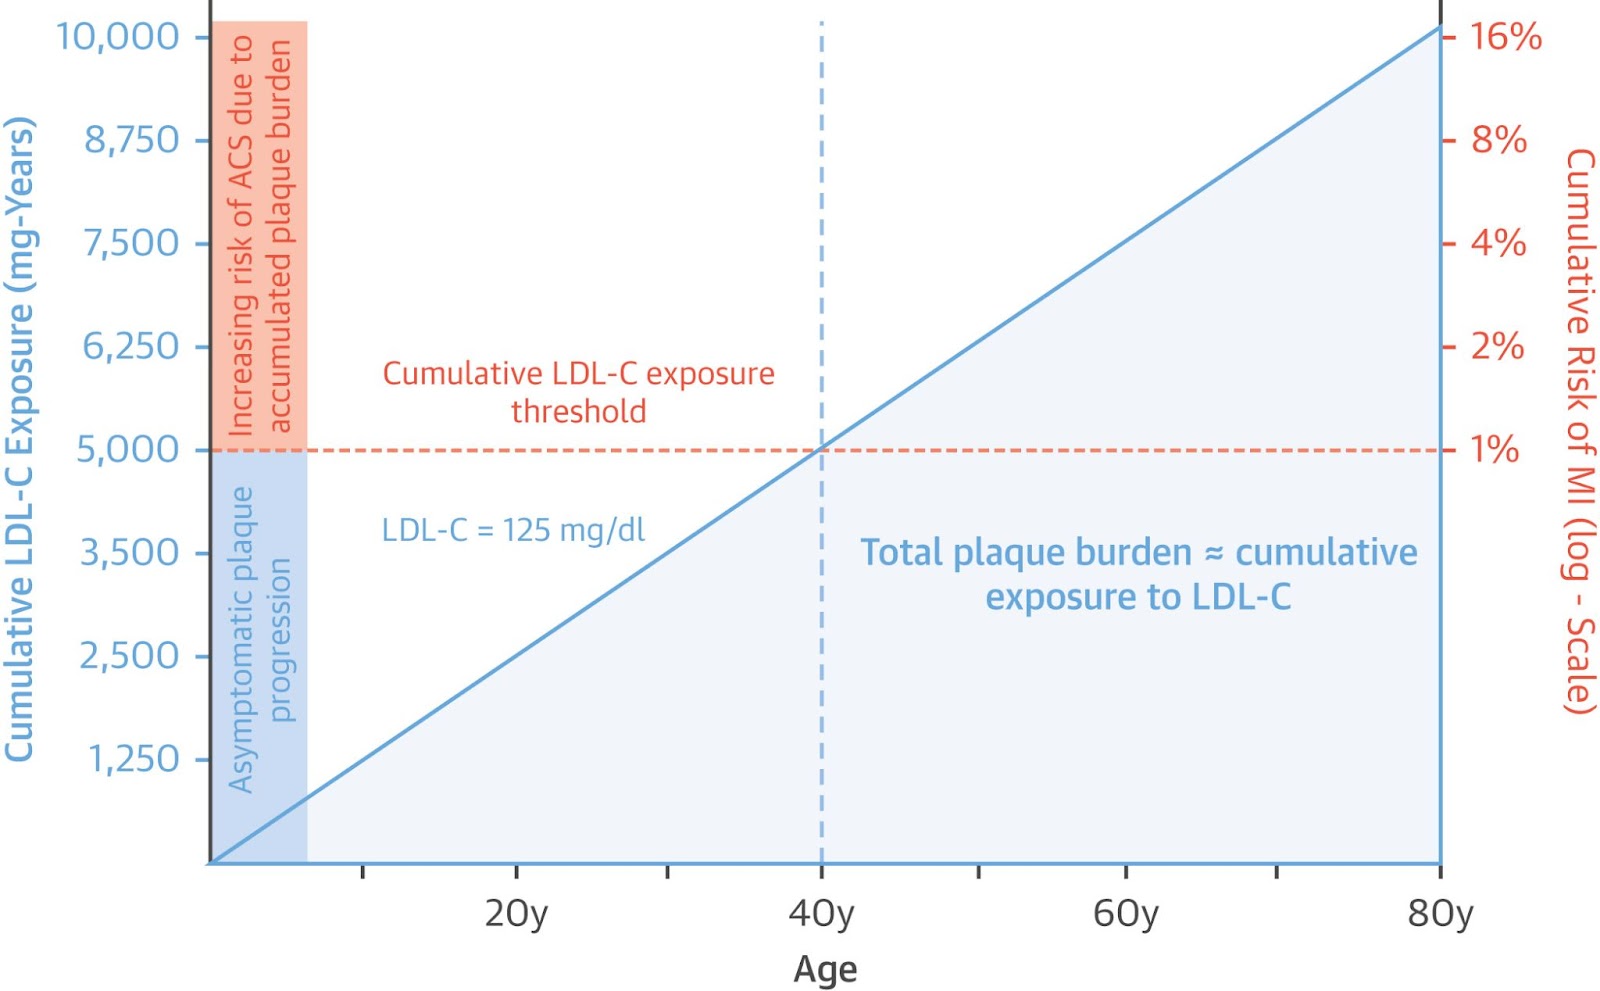
But that number doesn't tell the full story. Let's break it down: if I was born with an ApoB level of 40 mg/dL (the average at birth) and it steadily rose to 92 mg/dL by age 30, my cumulative exposure would already be 1,976 mg-years. That's how much stress my arteries endured by that point in my life. And if I had done nothing to lower it, that number would've kept climbing quickly, year after year.
Cardiovascular Risk Accelerates
Here's the critical part: risk doesn't increase linearly with cumulative exposure—it accelerates. As ApoB builds up over decades, the damage to your arteries compounds. For me, based on my total exposure, I already faced a 1% chance of a heart attack in my early 40s. That might not sound alarming at first glance. But if my ApoB levels had remained unchanged, my cumulative exposure by my 70s would have pushed my heart attack risk to 16%.
This isn't just a statistic—it was a wake-up call. It showed me how every year of elevated ApoB silently increases risk, compounding over time. By making lifestyle changes—adjusting my diet and committing to 30 minutes of exercise daily—I was able to lower my ApoB to 48 mg/dL. This single change pushed back the timeline for entering a higher-risk threshold by about a decade.
That's why tracking cumulative ApoB exposure is so critical. It gives you the clearest picture of how your arteries are aging and how intervening early can shape your future health.
A Better Risk Calculator
Despite how important cumulative ApoB exposure is for understanding cardiovascular risk, there hasn't been a tool to help people track it—until now. That's why we've built a better risk calculator at Instalab.
Our tool doesn't just measure your ApoB today—it helps you calculate your lifetime exposure and see how your risk changes over time. It also helps you track how your interventions—whether it's dietary changes, exercise, or medication—are actively reducing your long-term risk. It turns abstract numbers into something visual, actionable, and real.
If you're already testing with Instalab, your results are preloaded into the tool. Simply log in and see where you stand. But we also believe this information is too important to limit to just Instalab patients. That's why we've made this tool free and accessible for everyone. If you've had your ApoB tested elsewhere, you can upload your results and still get the same powerful insights.
Sources
- Packard, C., Weintraub, W., & Laufs, U. (2015). New metrics needed to visualize the long-term impact of early LDL-C lowering on the cardiovascular disease trajectory. Vascular pharmacology, 71, 37-9. https://doi.org/10.1016/j.vph.2015.03.008
- Ference, B., Graham, I., Tokgozoglu, L., & Catapano, A. (2018). Impact of Lipids on Cardiovascular Health: JACC Health Promotion Series. Journal of the American College of Cardiology, 72(10), 1141-1156. https://doi.org/10.1016/j.jacc.2018.06.046

The Top 3 Metrics to Track with a DEXA Scan
Most people think of DEXA scans as just a tool for measuring body fat precisely, but their true value lies in the deeper insights they provide. Visceral fat, muscle mass, and bone density are the three metrics that matter most. Together, they paint a clearer picture of your metabolic health, strength, and long-term risk for conditions like insulin resistance, fractures, and frailty.
Lab Tests | Body Composition
2025.01.06

Statins and Heart Health: Are They Worth the Risk?
Statins are among the most commonly prescribed medications worldwide for managing cholesterol levels. While their effectiveness in reducing cardiovascular risks is well-established, concerns about potential side effects often deter people from taking them. Here, we'll explore how statins work, assess their benefits, and weigh them against their risks to help you make an informed decision.
Heart Health | Medication
2024.11.21
Lowering Cholesterol Aggressively: Is It the Right Move?
Most doctors will tell you a LDL Cholesterol of 100 mg/dL is "good", leading many of us to believe that we have eliminated the risk of this disease if we hit this number. But this one-size-fits-all approach grossly oversimplifies the complexity of cardiovascular risk and leaves many of us unknowingly at high risk for heart-related events.
Heart Health | Prevention
2024.02.13

Intermittent Fasting Without the Typical Mistakes
Intermittent fasting (IF) has skyrocketed in popularity, widely embraced as a straightforward yet effective approach to weight management. Unlike traditional diets that dictate what to eat, IF focuses on when you eat, making it an appealing option for many. Patients often tell us they love its simplicity—but does the science truly back up the hype?
Weight Loss | Nutrition
2025.03.09